Forex trendline strategy
One of the most critical tools for forex traders is technical analysis, a method that involves analyzing historical price data to predict future market movements. Technical analysis is indispensable in forex trading because it helps traders identify patterns, trends, and potential reversal points, enabling more informed trading decisions.
A key component of technical analysis is the use of trendlines. Trendlines are straight lines drawn on a price chart to connect significant price points, typically the highs or lows, to highlight the prevailing direction of the market. They are essential for identifying and confirming trends, which is crucial for formulating trading strategies. Trendlines help traders distinguish between trending and non-trending markets, providing a visual representation of support and resistance levels.
By leveraging trendlines, traders can gain insights into the market's behavior and make predictions about future price movements. Understanding how to draw and interpret trendlines correctly can significantly enhance a trader's ability to anticipate market changes and execute trades with greater precision.
Understanding trendlines in forex
Trendlines are fundamental tools in technical analysis, providing traders with a visual representation of the market's direction. A trendline is a straight line that connects two or more significant price points on a chart, such as highs or lows. By extending this line into the future, traders can predict potential price movements and identify market trends.
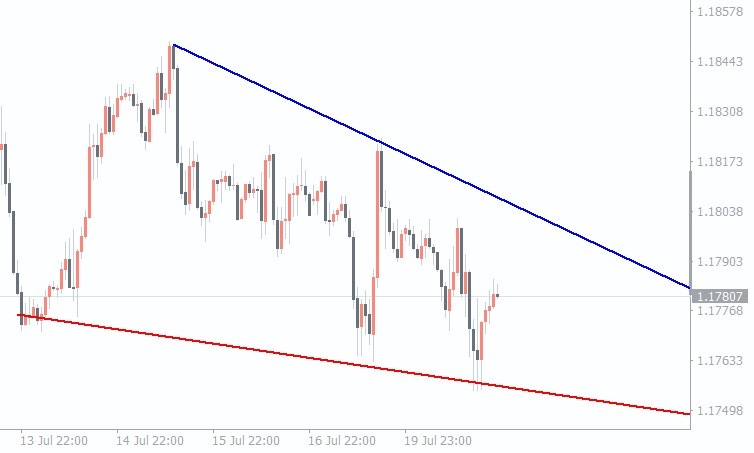
There are three primary types of trendlines: uptrend, downtrend, and horizontal. An uptrend line is drawn by connecting successive higher lows in a bullish market, indicating a general upward movement in prices. Conversely, a downtrend line connects successive lower highs in a bearish market, signifying a downward movement. A horizontal trendline, also known as a sideways trendline, is drawn across price points that are relatively stable, indicating a market that lacks a clear direction.
The significance of trendlines lies in their ability to help traders identify and confirm the direction of market trends. By analyzing trendlines, traders can distinguish between trending and consolidating markets, making more informed trading decisions. Trendlines also act as support and resistance levels, providing insights into potential reversal points.
Drawing trendlines accurately requires connecting at least two significant price points. For an uptrend line, traders should connect the lowest points of retracements in a rising market. For a downtrend line, they should connect the highest points of retracements in a falling market. Ensuring that the trendline touches as many price points as possible enhances its reliability. Accurate trendline drawing is essential for effectively utilizing them in trading strategies, providing a clearer picture of the market's behavior.
Forex trendline strategy
The basic principles of using trendlines in forex trading revolve around identifying the market's direction and making informed decisions based on these trends. Trendlines help traders spot the prevailing trend, whether it's an uptrend, downtrend, or sideways trend, enabling them to align their trading strategies accordingly. The principle is straightforward: buy during uptrends and sell during downtrends, while avoiding trading in sideways markets.
Identifying and confirming trends with trendlines involves drawing lines that connect at least two significant price points, such as highs or lows. For an uptrend, connect the higher lows, and for a downtrend, connect the lower highs. The more points a trendline touches, the stronger the trend. Confirmation comes from the price respecting the trendline over time, indicating a reliable trend.
Combining trendlines with other technical indicators can enhance their effectiveness. Indicators like moving averages, Relative Strength Index (RSI), and volume can provide additional confirmation of trends and potential reversal points. For instance, if a trendline breakout coincides with a moving average crossover or a significant change in volume, it strengthens the signal and increases the likelihood of a successful trade.
Examples of effective trendline strategies include the trendline bounce and trendline breakout strategies. In the trendline bounce strategy, traders enter trades when the price bounces off the trendline, confirming the trend's continuation. In the trendline breakout strategy, traders enter trades when the price breaks through the trendline, indicating a potential reversal or acceleration in the trend. These strategies, when used correctly, can significantly enhance trading outcomes and help traders navigate the forex market with greater confidence.

Forex trendline breakout strategy
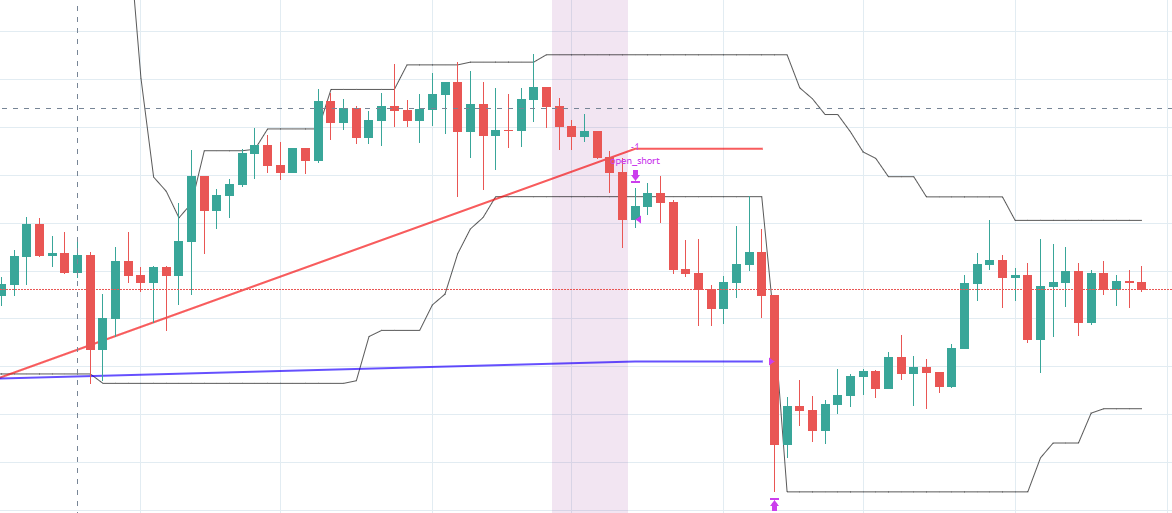
A trendline breakout occurs when the price moves beyond a previously established trendline, signaling a potential shift in market direction. This breakout indicates that the prevailing trend may be weakening or reversing, offering traders an opportunity to capitalize on new market movements.
Identifying potential breakout points involves closely monitoring the price action as it approaches the trendline. A breakout is confirmed when the price closes beyond the trendline, rather than just briefly touching or crossing it. Traders should look for sustained movement in the direction of the breakout to ensure it is not a false signal.
Confirmation of breakouts can be strengthened using volume and other technical indicators. An increase in trading volume during a breakout suggests strong market interest and supports the validity of the breakout. Additionally, indicators such as the Relative Strength Index (RSI) or Moving Average Convergence Divergence (MACD) can provide further confirmation. For instance, if the RSI crosses above 50 during an upward breakout or if the MACD shows a bullish crossover, the breakout signal gains credibility.
Strategies for trading trendline breakouts include entering trades immediately after the breakout is confirmed and setting stop-loss orders just beyond the trendline to manage risk. Traders might also consider waiting for a pullback to the trendline, providing a more favorable entry point.
Risk management in trendline breakout trading is crucial to protect against false breakouts. This involves setting appropriate stop-loss levels to limit potential losses and employing position sizing techniques to manage exposure. By combining careful analysis with robust risk management practices, traders can effectively navigate trendline breakouts and enhance their trading performance.

Trendline break strategy
Understanding false breakouts and how to avoid them is crucial in forex trading. A false breakout occurs when the price moves beyond a trendline but fails to sustain the direction, quickly reversing and trapping traders. To avoid false breakouts, traders should look for confirmation signals and avoid acting on the initial breakout alone. This can involve waiting for the price to close beyond the trendline or observing increased trading volume.
Techniques for validating true breakouts include using multiple time frame analysis and combining trendlines with other technical indicators. Analyzing breakouts on different time frames helps verify the strength of the breakout. For instance, a breakout on both the daily and weekly charts is more reliable than on a single time frame. Additionally, confirming breakouts with indicators such as the Moving Average Convergence Divergence (MACD), which shows momentum shifts, or the Relative Strength Index (RSI), which indicates overbought or oversold conditions, can help validate the breakout's legitimacy.
Case studies and examples of successful trendline break strategies demonstrate their effectiveness. For instance, a trader might observe an ascending trendline on a currency pair's chart. After multiple touches, the price breaks above the trendline with high volume and a bullish RSI crossover. Entering a long position at this point, the trader sets a stop-loss just below the trendline. The price continues to rise, validating the breakout and resulting in a profitable trade.
Advantages and limitations of forex trendline strategies
Benefits of using trendlines in forex trading are manifold. Trendlines provide a straightforward and visual method for identifying market trends, enabling traders to make informed decisions about entry and exit points. They help in recognizing support and resistance levels, which are crucial for setting stop-loss and take-profit orders. Trendlines can be used in conjunction with other technical indicators to strengthen trading signals, making them versatile tools in a trader's arsenal. Additionally, trendlines can simplify the analysis process, reducing the cognitive load on traders by offering clear, actionable insights.
Common pitfalls and limitations of trendline strategies also need consideration. One major limitation is the subjective nature of drawing trendlines; different traders might draw them differently based on their perspectives, leading to inconsistent results. Trendlines can also be less effective in choppy or sideways markets where price action lacks a clear direction. Another pitfall is over-reliance on trendlines without considering other market factors, which can lead to poor trading decisions. False breakouts, where the price briefly moves beyond the trendline but then reverses, can also trap traders and result in losses.
Mitigating risks associated with trendline strategies involves a multi-faceted approach. To reduce the subjectivity of drawing trendlines, traders should adhere to established rules, such as connecting at least two significant price points and ensuring the trendline touches as many points as possible. Combining trendlines with other technical indicators, like moving averages or the Relative Strength Index (RSI), can provide additional confirmation and reduce false signals. Risk management practices, such as setting stop-loss orders and avoiding over-leveraging, are essential to protect against unexpected market movements. Regularly reviewing and adjusting trendlines as new data becomes available can also help maintain their accuracy and relevance.
Conclusion
In summary, the forex trendline strategy is a vital tool in the arsenal of any forex trader. Practicing and refining trendline strategies is crucial for achieving consistent success in forex trading. Traders are encouraged to continually hone their skills by applying trendline techniques in various market conditions and incorporating feedback from their trading experiences. Keeping a trading journal, backtesting strategies, and learning from both successes and failures will contribute to a deeper understanding and more effective use of trendlines.
In conclusion, mastering trendline strategies can significantly improve a trader's ability to navigate the forex market. Trendlines offer a clear and visual method for identifying trends, providing critical insights into potential entry and exit points. By combining trendlines with other technical analysis tools and following to strong risk management practices, traders can enhance their decision-making processes and increase their chances of achieving long-term trading success.


