Momentum Indicator Strategy
Momentum is a very important concept in the forex market therefore incorporating momentum indicators as an integral part of technical analysis is an ideal way to build a strong trading strategy that minimizes risk and maximizes the overall return or profits of trading portfolios.
Among the other oscillator-grouped indicators used to measure the strength or speed of price movement is the ‘Momentum Indicator’.
It compares the most recent closing price to a previous closing price from any timeframe. This comparison measures the velocity of price changes and it is represented by a single line.
The indicator shows in a different way what can be seen on the price chart. For instance, if the price rises strongly but then moves sideways, the Momentum Indicator will rise and then start dropping but that does not always mean that price movement is going to drop correspondingly.
Basic Principles of Momentum Trading
There are some basic principles of the forex market that must be reviewed to implement the Momentum Indicator effectively and profitably.
1. It is a known concept in forex trading that momentum precedes price. This implies that the Momentum Indicator works best as a trend following indicator.
2. Just like in physics, momentum is used to denote an object that is in motion so is it in the forex market. Momentum refers to a market that is in motion either in an uptrend or in a downtrend
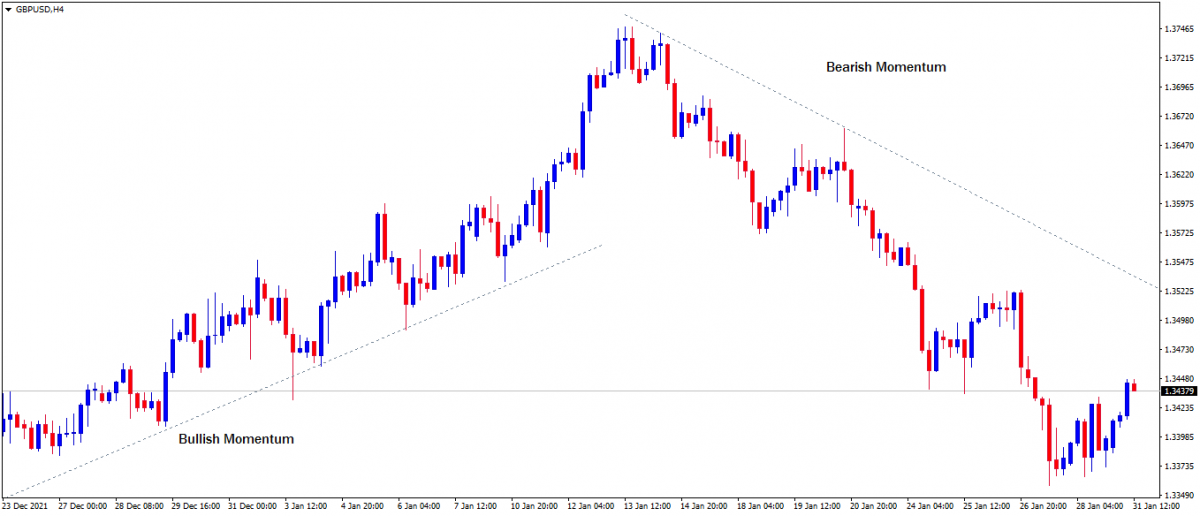
3. Newton law of motion states that 'an object in motion (momentum) tends to stay in motion until the object encounters some external force'. Likewise in the forex market, trends tend to remain in place but long term trends in particular and these leads to the next principle.
4. Higher timeframe analysis dominates over lower timeframe analysis. This means that the momentum in the higher timeframe is dominant over the momentum in the lower timeframe.
For example, If the momentum on the weekly chart is bearish and the momentum on the 4hour chart is bullish. Soon enough, the bearish dominant momentum of the weekly chart will reverse the bullish momentum of the 1Hr chart to bearish.
GbpUsd Weekly and 4Hr Chart
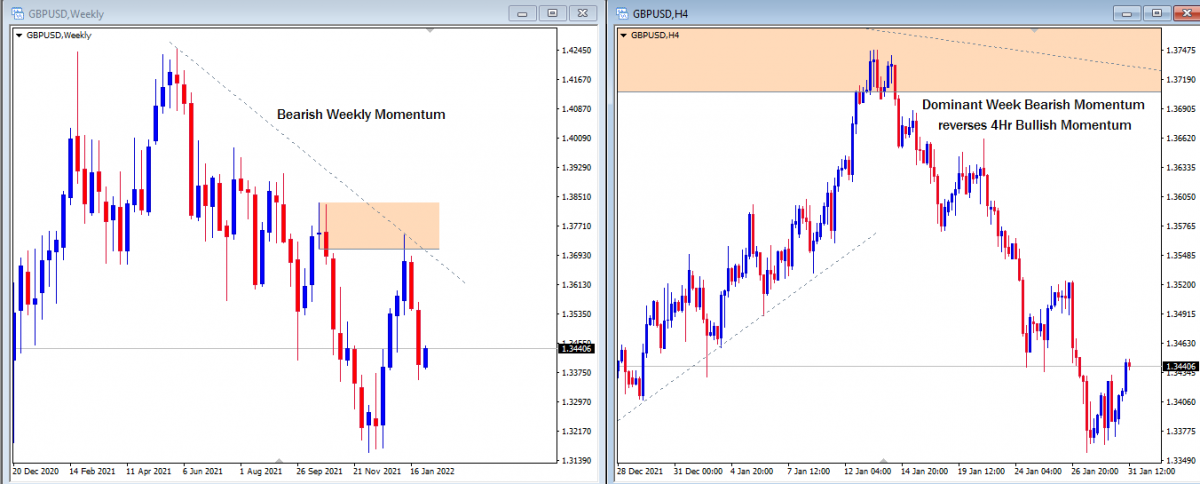
Therefore, the overall momentum of the market is dependent on the higher timeframe momentum.
5. All these conditions makes the momentum indicator the best for swing trading i.e. to capitalize on the momentum of price movement by holding on to a trade for a couple of days to maximize profits.
Setting Up The Momentum Indicator
The default and standard input value of the Momentum Indicator is 14. This input value can be modified to provide the desired result that suits a trader's needs or expectations.
Increasing the input value reduces the indicator sensitivity respectively. If the input value is increased above 20, it makes the indicator less sensitive, hence fewer but quality signals are produced.
On the other hand, simultaneous reduction of the input value increases the indicator sensitivity respectively. If the input value is reduced below 7, it makes the indicator oversensitive to price movement thereby producing many signals of which most are false.
How to Read the Momentum Indicator
- First, delineate the 100 level of the indicator with a horizontal line as a standard reference point for bullish and bearish momentum.
- If the Momentum Indicator reads above the 100 level reference point, it means the market directional bias or momentum is bullish.
- If the Momentum Indicator reads above the 100 level reference point at the same time price is in an uptrend, it suggests that the current bullish trend is strong and likely to continue.
- If above the 100 level reference point, the indicator line begins to drop. This doesn't mean a direct bearish reversal of the uptrend. It suggests that the current bullish trend or momentum to the upside is waning.
- If the Momentum Indicator reads below 100 level reference point, it means the market directional bias or momentum is bearish.
- If the Momentum Indicator reads below the 100 level at the same time price is in a downtrend, it suggests that the current bearish trend is strong and likely to continue.
- If below the 100 level reference point, the indicator line begins to rise. This doesn't mean a direct bullish reversal of a downtrend. It suggests that the current bearish trend or momentum to the downside is waning.
Momentum Indicator Trading Strategies
The Momentum Indicator does provide trading signals but the indicator is best used to confirm the signals of other trading strategies or to indicate a market environment or bias that is suitable for high probable trade setups.
- 100-Level Reference point Crossover Strategy
This is the simplest trading strategy of the Momentum Indicator. Trading the 100-level reference point bullish or bearish crossover signals.
How does this work?
When the indicator line crosses above the 100-level reference point, it indicates that the momentum or the directional bias of the market is bullish and so traders can open a long position.
Conversely, if the indicator line crosses below the 100-level reference point, it indicates that the market is in a bearish environment and traders can open a short position.
Example of a Bearish Momentum on the EurUsd Daily Chart.
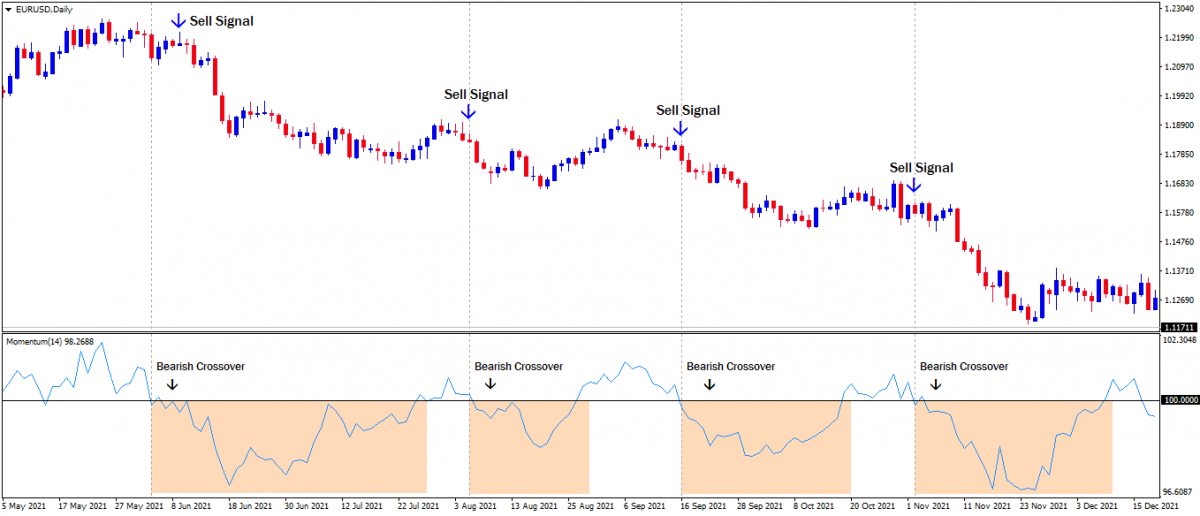
The market has been on a steady decline for over 6 months beginning at the bearish crossover of the 100-level reference point in June. Since then, EURUSD have remained strongly bearish and the Momentum Indicator have also produced 3 other strong bearish crossover signals.
- Overbought and Oversold Trading Strategy
The Momentum Indicator can be used to identify a market that is in an overbought or oversold condition. Overbought and oversold signals identified on the indicator should not be traded as direct reversal signals instead they are best used to exit profitable trades. This is what makes the Momentum Indicator distinct from other indicators because it can also be used as an effective tool for profit management.
How do we identify overbought and oversold levels?
When the indicator line rises above the 100-level reference point, it means the market is in a bullish trend. If the indicator line then begins to decline, it suggests that the bullish trend is overbought and as a result, price may either reverse or consolidate. At this point, it is best for traders to take partial profits or completely exit from a profitable buy trade.
On the contrary, when the indicator line is below the 100-level reference point, it means the market is in a bearish trend. If the indicator line then begins to rise, it suggests that the bearish trend is oversold and as a result, price may either go into a bullish reversal or a consolidation. At this point, it is best to take partial profits or completely exit from a profitable sell trade.
Following The EurUsd Example Above, The Indicator Also Signals Oversold Levels in a Downtrend.
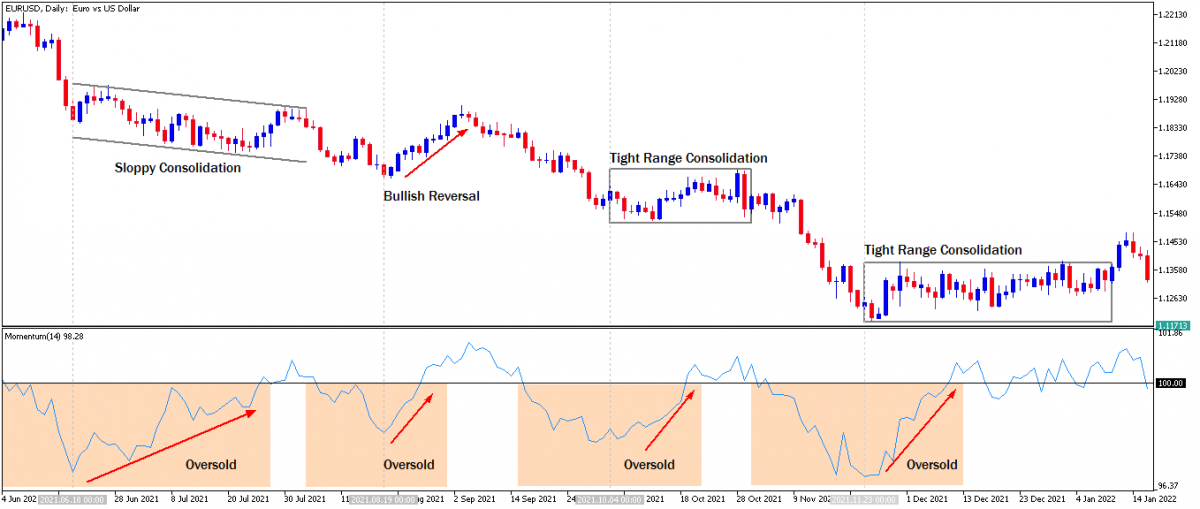
After the first crossover sell signal, the indicator line begins to rise. This means that the market is oversold and as a result, price movement can be seen in a sloppy consolidating chanel.
After the second crossover sell signal, the indicator line begins to rise to signal that the market is oversold and as a result, price movement reversed in a bullish direction.
Lastly, after the third and fourth crossover sell signal, the indicator line rises to signal that the market is oversold. As a result, price movement began to move sideway in a tight consolidation.
To manage the profitable trades effectively, each time the momentum indicator signals an oversold market condition, profits should either be partially or completely closed.
- Divergence Trading Strategy
The Momentum Indicator can be useful to spot subtle shifts between supply and demand of market participants by identifying the divergence that exist between price movement and the momentum indicator.
Divergence occurs when the price movement is not in symmetry with the indicator line movement.
For instance, if price movements make higher highs and the indicator line makes higher lows instead of a higher high, this unsymmetrical price move is a bearish divergence signal. Traders can open a sell trade position.
Example Of Overbought And 0versold Trade Signals. GbpUsd Daily Chart.
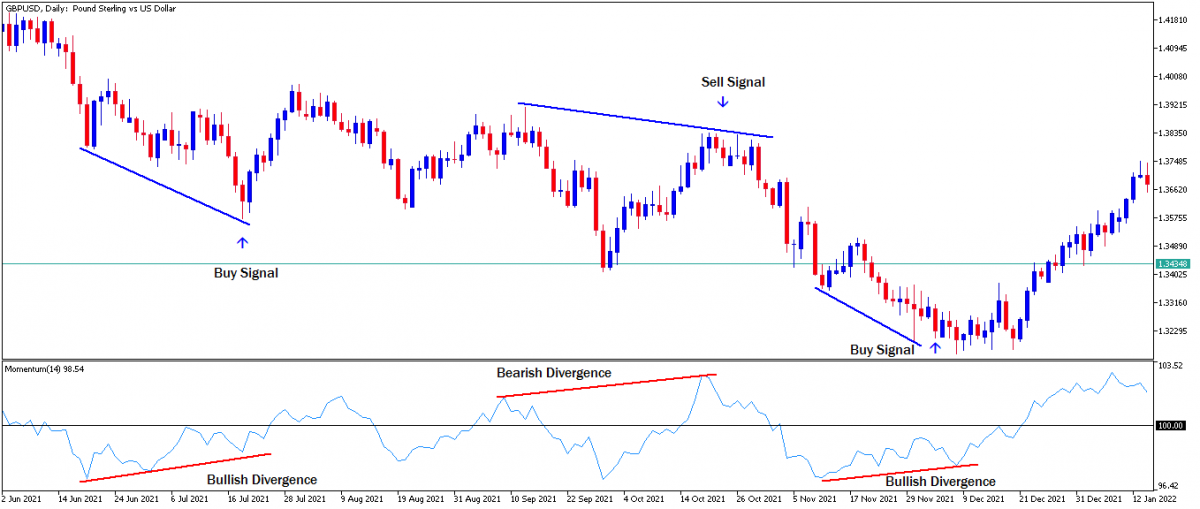
If price movements make lower lows and the indicator line makes lower highs instead of similar lower lows, this unsymmetrical price move is a bullish divergence signal. Traders can open a buy trade position.
- Support and Resistance Trading Strategy
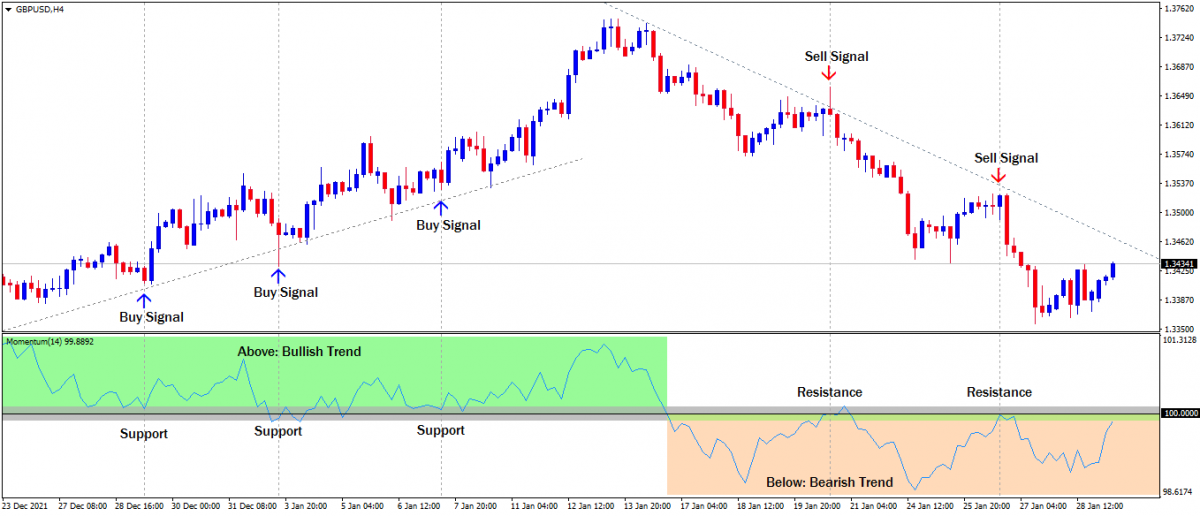
The indicator line measuring the velocity of price movement oftentimes bounce off the 100-level reference point like support and resistance. The bounce is usually reflected in price movement.
A bounce on the 100-level reference point as support is seen with a rally in price movement and a bounce from below the 100-level reference point as resistance is seen with a decline in price movement.
Hence traders can open a long position when the indicator line hit the 100-level reference point as support and also traders can open a short position when the indicator line is rejected from the 100-level reference point as resistance.
Example of Momentum Indicator Support and Resistance Trading Strategy. GbpUsd 4Hr Chart.
Conclusion
The Momentum Indicator signals are best effective when in confluence confirmation with other indicator signals but before implementing any of the Momentum Indicator strategies, it is important to first analyse the underlying tone of the market. This will improve the quality of the trade signals that should be taken.
Click on the button below to Download our "Momentum Indicator Strategy" Guide in PDF


