SUPPORT/RESISTANCE LEVELS AND PIVOT POINTS - Lesson 3
In this lesson you will learn:
- What are the Support/Resistance and Pivot Points
- How they are used in trading
- How to calculate the Daily Pivot Points
Support and Resistance are tools that are used by technical analysts in order to identify and follow trends, where horizontal lines are drawn on the chart to indicate areas of support and resistance.
When calculated each day, support, resistance and the daily pivot points do not change on the chart depending on the time period you select, or based on the settings you prefer. They do not adjust to current price, but they remain constant and absolute. They provide one of the surest ways of identifying bullish and bearish conditions for currency pairs and other securities on the given day.
It is important to note that while the support and resistance levels rely mostly on the subjective placement of each trader that will assist in identifying the possible breakout points, pivot points are identified based on specific calculations to spot important levels of overall price trends.
There are different versions for the calculation of these various lines and points drawn on our charts and they can be automatically selected on major charting packages that come as part of trading platform packages. Typically there are: standard, Camarilla and Fibonacci support and resistance calculations. The majority of traders choose to make trading decisions based on the standard measurements. There are also, as standard, three levels of support and resistance often drawn on charts: S1, S2 and S3 and R1, R2 and R3.
The mathematical calculations to arrive at support, resistance and the daily pivot point metrics are fairly simple. You may have noticed that, if you select them to appear on your trading platform, then they'll be automatically recalculated and redrawn each day, immediately when what's termed the "New York" afternoon session closes, signifying the end of the trading day as we move into a new trading day with the "Asian market" opening. The levels are calculated by the high, low and close of the past day to arrive at new calculations for the current day. You can also use one of the many calculators available to make your own calculations.
Traders use support and resistance in a variety of methods; many use them to determine key areas on which to place their stops, or take profit limit orders. Many will enter trades once price breaks through these key levels. For example, if the market price is above R1, then the security/currency pair is considered to be bullish, conversely if the market price is below S1, then it is considered to be bearish.
A breakthrough is considered to be an important moment in trading as it tends to lead to a rapid increase in volatility.
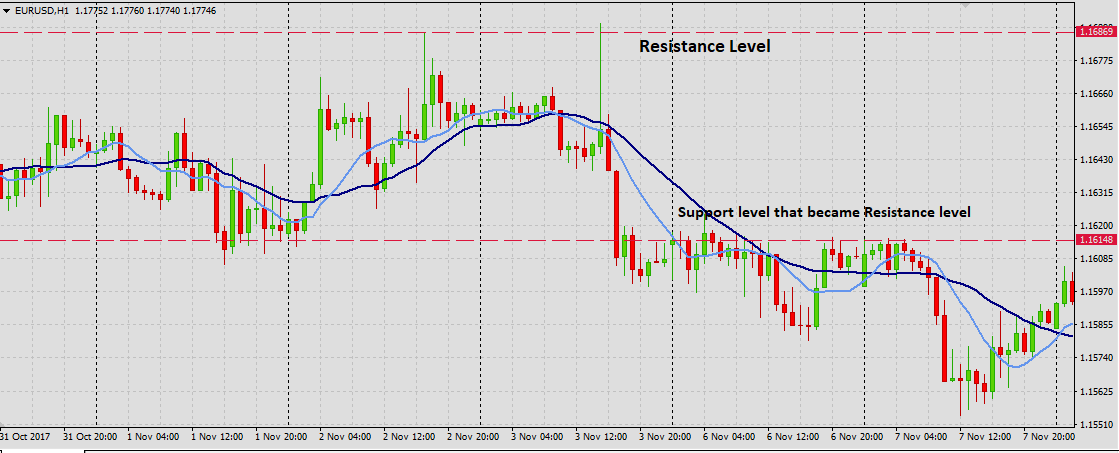
A support is a level or area on the chart that is below the current price, where buying interest has exceeded the selling pressure and the price advances. Whereas, the resistance is a level on the chart above the current price, where selling pressure exceeded the buying pressure and the price declines.
It is important to mention that those lines can be penetrated and once they are broken, the roles can be reversed, which happens usually when the trend is changing and breaking the support line can act as a resistance, and vice versa.

Traders are fond of saying that price doesn't suddenly move because, for example, the moving averages on the MACD overlap and therefore the trend changes from bullish to bearish. Or if the stochastic lines cross, or if the RSI enters oversold conditions. Technical indicators lag, they never lead, they reveal the past, and they can't possibly predict the future. However, what is undeniable is that price does technically react to support and resistance levels, because this is where many orders; buy, sell, stop and take profit limit orders, will be clustered. This is where many market makers and operators will hunt for profit and therefore it's where price action may also appear to happen most regularly.
Calculating the Daily Pivot Points
The accepted method to calculate the standard daily pivot point level is to take the low, the high and the close of the previous days’ trading sessions and then to use these three metrics to provide a level, from which all other calculations will be made. The simple method of arithmetic is adopted then, to determine the three levels of support and resistance.
- Pivot point (PP) = (High + Low +Close)/3
- First resistance (R1) = (2xxPP)-Low
- First support (S1) = (2xPP)-High
- Second resistance (R2) = PP + (High – Low)
- Second support (S2) = PP – (High – Low)
- Third resistance (R3) = High + 2 x (PP-Low)
Pivot points, along with support and resistance levels are a useful tool that allow the trader to avoid making the same mistakes day after day, thus limit the trading loss to a small percentage of the trading account, based on the risk management previously established. In addition, using pivot points simplifies the way of determining if the market for a particular currency pair is in a range, or if it is trending, is it bullish or bearish direction, which leads to more informed trading decisions.


