What is the ATR indicator in Forex and How to use it
Among the most prominent technical analysts in the field to have written extensively about volatility was J Welles Wilder. He introduced many technical indicators in his 1978 book titled 'New Concepts in Technical Trading', which are still very relevant in today's modern technical analysis. Some of them include the Parabolic SAR Indicator (PSAR), Average True Range Indicator (or ATR indicator) and the Relative Strength Index (RSI).
This article discusses the Average True Range indicator, which was developed as a qualitative approach to assigning numerical values to underlying volatility in financial markets.
Volatility measures how fast the price movement of an asset changes compared with the average rate of changes over a given period of time. As volatility indicators track an asset's volatility, traders can determine when an asset's price will become more or less sporadic.
In essence, the ATR measures volatility except that it cannot predict trend direction or measure momentum.
How does the ATR indicator measures the volatility of an asset?
By studying the commodity market, Wilder discovered that a simple comparison of the daily trading ranges was insufficient to measure volatility. According to him, in order to calculate volatility within a time period accurately, the previous session's close as well as the current high and low ought to be taken into account.
Thus, he defined the true range as the largest of the following three values:
- The difference between the current high and low
- The difference between the previous period's close and the current high
- The difference between the previous period's close and the current low
Wilder further suggested that taking a weighted average of these values over several days would provide a meaningful measure of volatility. This he called the Average True Range.
In his calculation, only the absolute value is taken into account, regardless of whether it is negative or positive. Following the calculation of the first ATR, the subsequent ATR values are calculated with the formula below:
ATR = ((Previous ATR x (n-1)) + Current TR) /(n-1)
Where ‘n’ is the number of periods
On most trading platforms, the default 'n' is usually set to 14, but traders can adjust the number according to their needs. Obviously adjusting the ‘n’ to a higher value will result in a lower measure of volatility. However, adjusting the ‘n’ to a lower value will result in a faster measure of volatility. In essence, the Average True Range is the weighted moving average of true ranges over a certain period.
Trading platforms such as MT4 and MT5 already have an inbuilt calculation for the average true range indicator, so traders do not need to worry about figuring out these calculations.
Example of the average true range (ATR) calculation
For example, the ATR for the first day of the 10-day period is 1.5 and the ATR for the eleventh day is 1.11.
You can estimate the sequential ATR using the previous value of the ATR, combined with the true range for the current period, plus the number of days less one.
Next, this sum will be divided by the number of days and the formula repeated over time as the value changes.
In this case, the second value of the ATR is estimated to be 1.461, or (1.5 * (10 - 1) + (1.11)) / 10.
As a next step, we will review how to use the ATR indicator in trading platforms.
How to use ATR indicators on trading platforms
The Average True Range indicator is among the package of indicators that is inbuilt into most trading platforms like Mt4, Mt5 and TradingView.
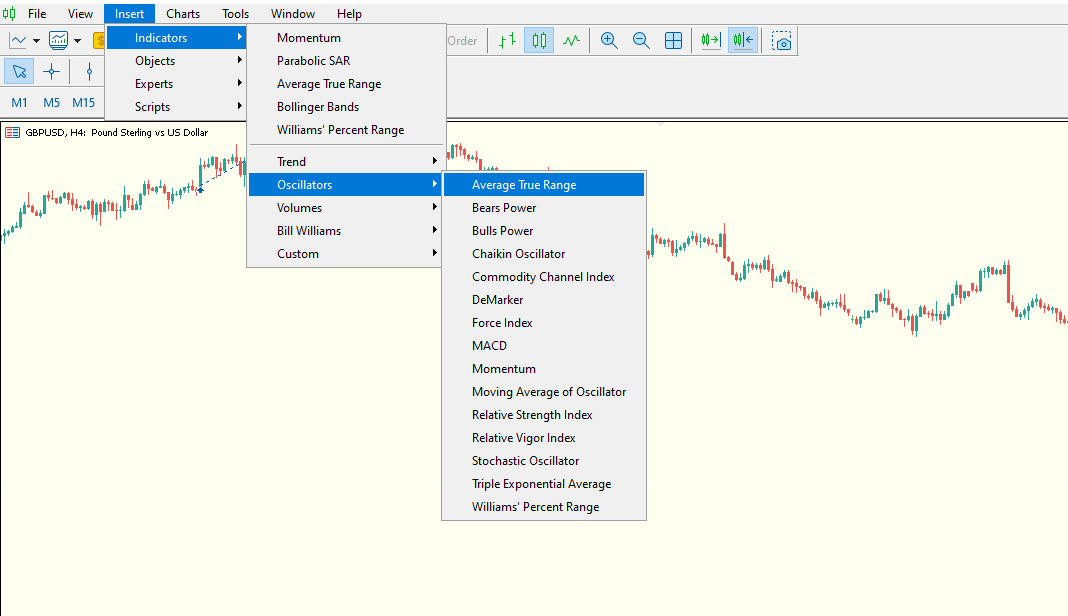
To find the Average True Range indicator in the Mt4 platform
- Click on insert right above the price chart
- In the drop-down menu of the indicator section, scroll down to the oscillator indicators section.
- Click on the Average True Range indicator to add it to your price chart.

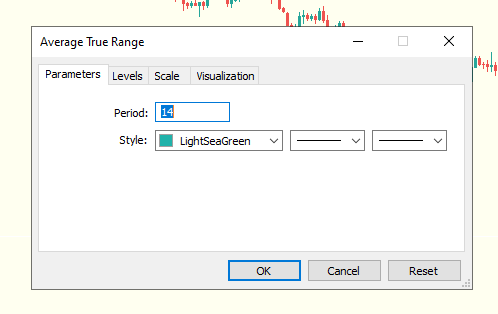
As soon as it is added to your price chart, you will be presented with the ATR indicator settings window. The only variable that you might adjust to suit your preference is the number of periods over which the Average True Range will be calculated.

As shown in the above image, MT4 and MT5 have a default ATR indicator value of 14, which is a helpful starting point for traders. Traders can experiment with different periods to find the exact period that might work best for them.
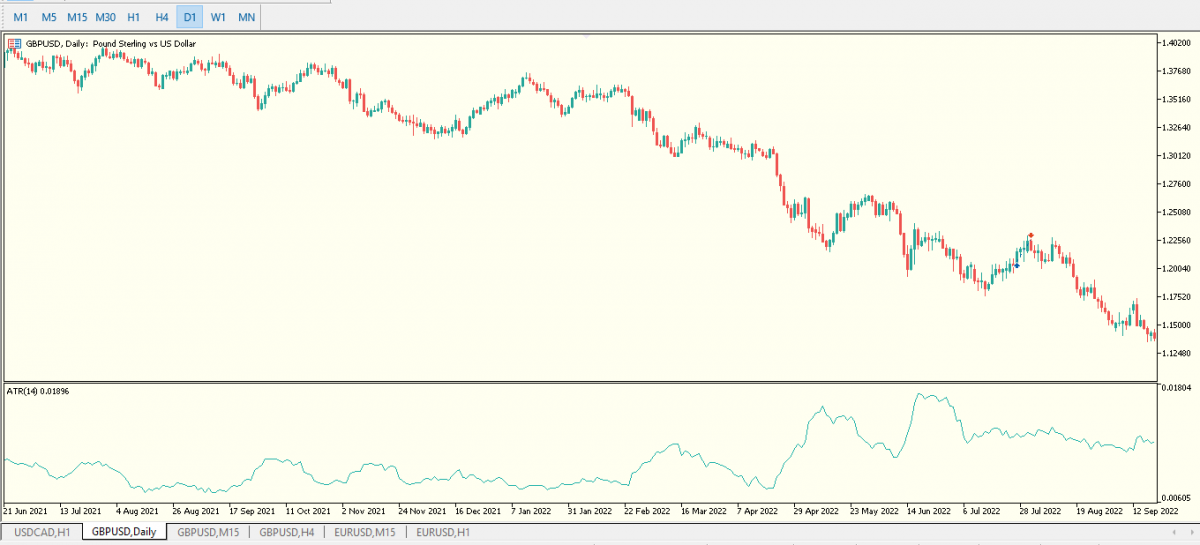
As soon as the indicator is added to your trading platform, a graph displaying the Average True Ranges will appear beneath your price chart, as shown below.

The ATR indicator values can be interpreted in a straightforward manner. The highs of the ATR indicator chart reflect a more volatile trading period, while the lows reflect a lesser volatile trading period.
By understanding the volatility in the market, traders can set definitive price targets and profit objectives. As an example, if the EURUSD currency pair has an ATR of 50 pips over the last 14 periods. A profit objective of below 50 pips will be more likely to be achieved within the current trading session.
How to use the average trading range indicator in trading
Using the values of the average true range indicator, this can estimate how far the price movement of a financial asset can extend within a specific period of time. This information can also be used to identify trade opportunities such as:
- Consolidation breakouts
Consolidation breakouts represent one of the finest quality of trading opportunities in the forex market. With the help of the average true range indicator, traders can time these breakouts efficiently and get in on the ground floor of a new trend as it develops.
In low volatile markets when price movement is in a consolidation, the average true range indicator will display troughs of lower values. After a period of low or flat values, as the volatility of the market increases, a surge in the ATR will indicate higher volatility in the market and display peaks of higher values. The result of this is the breakout of price movement out of the consolidation. After the breakout, traders can plan on how and where to enter a trade with the appropraite stop loss.
- Combination of ATR indicator with other indicators
The ATR is only a measure of market volatility. Thus, combining the ATR indicator with other indicators is fundamental to identifying more trading opportunities. Here are the most effective combination strategies for the ATR indicator.
- Using the exponential moving average as a signal line
The ATR is only a measure of volatility and does not readily generate entry signals in trending markets. In this regard, to make the ATR indicator more effective and efficient, traders can overlay an exponential moving average on the ATR indicator to act as a signal line.
A profitable trading strategy might be to add a 30-period exponential moving average over the ATR and watching out for cross-over signals.
When price movement is in an uptrend and the ATR indicator crosses above the exponential moving average. This suggests a strongly bullish market. Hence, traders can open more buy orders in the market. The opposite for price movement in a down trend is that; if the ATR indicator crosses below the exponential moving average, it suggests a strongly bearish market, highly profitable for short selling.
- Combination of ATR indicator and Parabolic SAR
ATR combination with Parabolic SAR is also effective for trading markets that are trending. Together with the ATR, traders can establish definitive stop loss and take profit price points. This will ensure that they take full advantage of a trending market with minimal risk exposure.
- Combination of ATR indicator and Stochastics
Stochastics: With their ability to deliver overbought and oversold signals, they are very effective for trading large-ranging markets when the value of the ATR indicator is low. In essence, the ATR indicator helps to qualify ranging markets by reading low volatility, then the buy/sell signals can be provided by reading the Stochastics crossovers in overbought and oversold zones.
- Trading lot sizing
The size of a position or lot is an important decision-making process for managing risk when trading financial assets. With appropriate lot sizes for different financial assets, traders can minimise their risk exposure and increase their market performance significantly.
Generally, it is recommended to trade high-volatility markets with smaller lot sizes, while larger lots are recommended for low-volatility markets.
Forex pairs with high ATR values, such as GBPUSD and USDCAD, can be traded with smaller lot sizes; in contrast, assets with low ATR values, such as commodities, can be traded with larger lot sizes.
Limitations of the average true range indicator
These limitations must be taken into consideration when using the ATR indicator. Firstly, the ATR indicator reflects only the volatility of price movement. Secondly, the ATR readings is subjective and open to varying interpretations. There is no specific ATR value that can predict the exact turning point of a trend or price movement. ATR readings can therefore serve as an indication of the strength or weakness of a trend.
Click on the button below to Download our "What is the ATR indicator in Forex and How to use it" Guide in PDF


